In the Swiss Tram Stats series, we take a look at how Switzerlands tram networks are changing and evolving. This is the 2023 update in which we also reveal which network is actually the fastest and why.
Switzerland is tram country. In four cities, trams are the backbone of mobility and an essential part of everyday life. Two more cities are about to join. But even if the networks look kind of uniform, they show considerable differences at a closer look. And they include a wide range of what’s commonly known as «tram»: From old, slow and winding city-centre tracks up to modern, fast and even partially elevated suburban light-rail lines.
Note: This article is based on 2023 timetable and network data. The next update is posponed until 2026, when services in Zurich return to normal operations after this year’s construction phase.
_01
General
Stats
The number of cities with a tram network remains unchanged: 4. Genève, Zürich, Bern and Basel. Note: I’m not counting Neuchâtel since the Neuchâtel-Boudry line is a standard narrow gauge line with a standard signalling system, even if it was once part of the citiy’s now dismanteled tram network. The same goes for Waldenburgerbahn, Ferrovie Lugano – Ponte-Tresa and Appenzellerbahnen’s Appenzell – Trogen line. These all are standard narrow gauge railway lines, even if they are operated with tram-like wehicles.
_01.1
Network overview
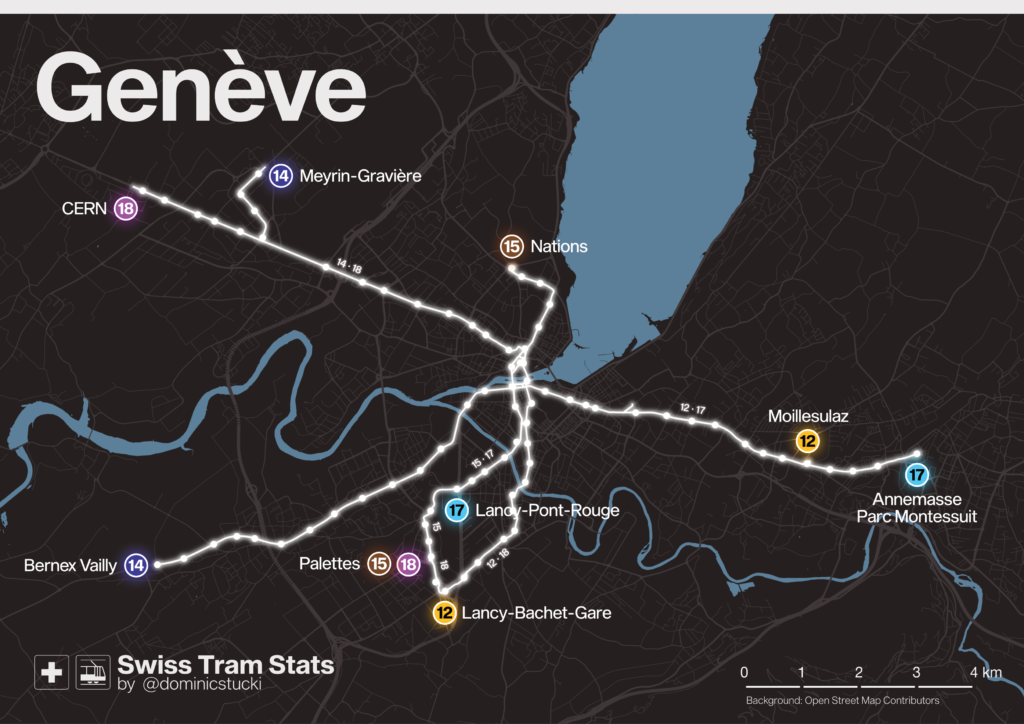
🟧 Genève (since 1862)
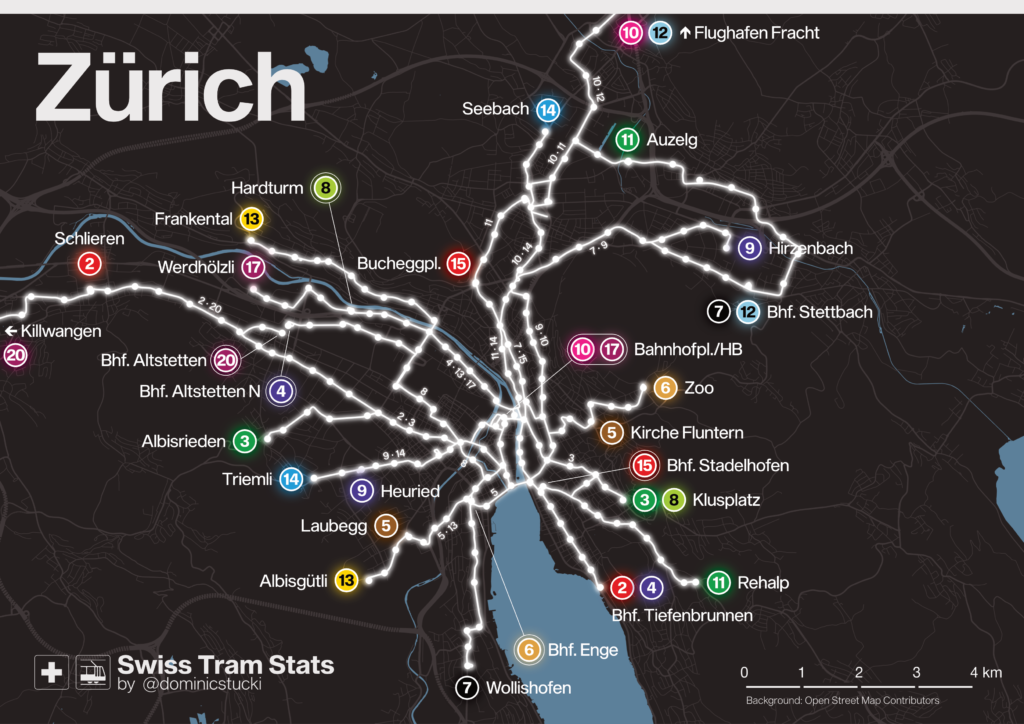
🟦 Zürich (since 1882)
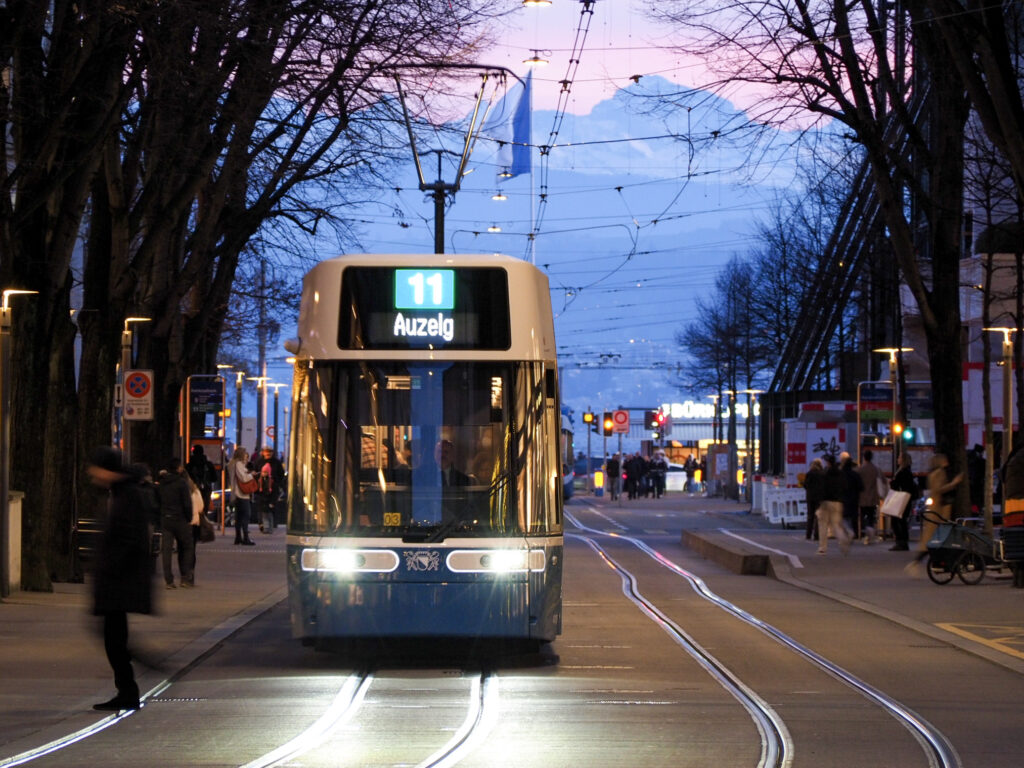
🟥 Bern (since 1890)
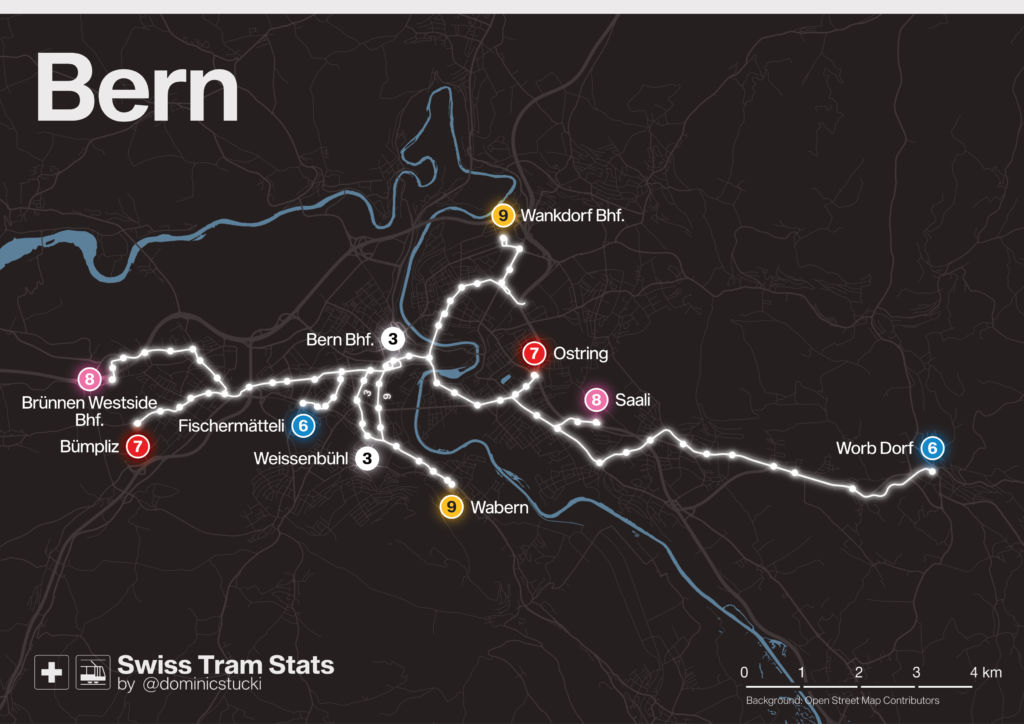
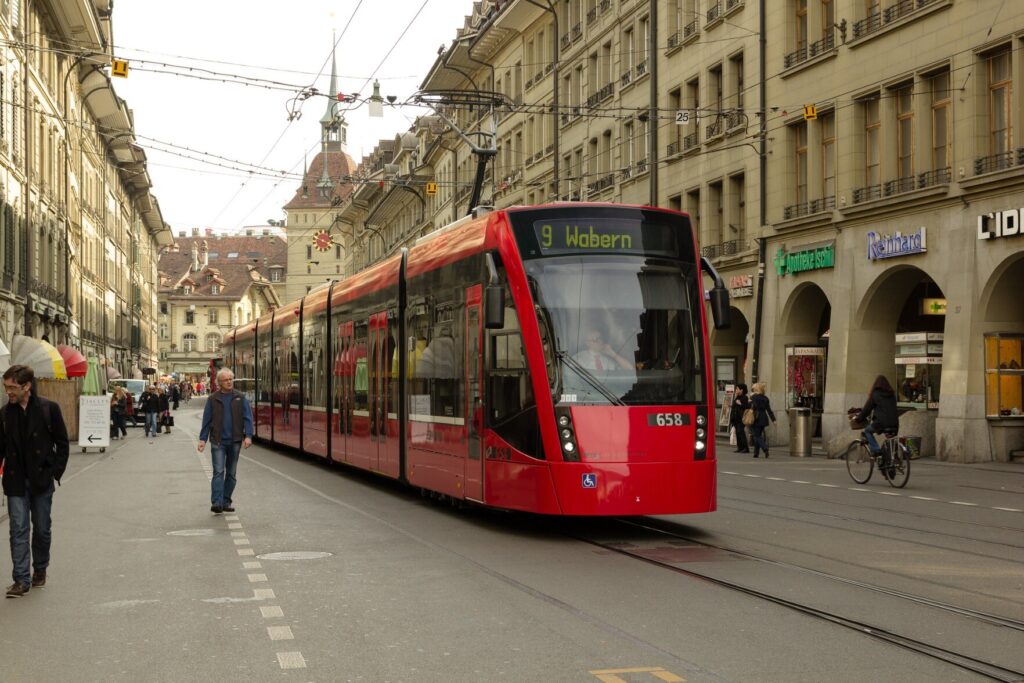
Foto Bern: t-mizo (CC BY 2.0)
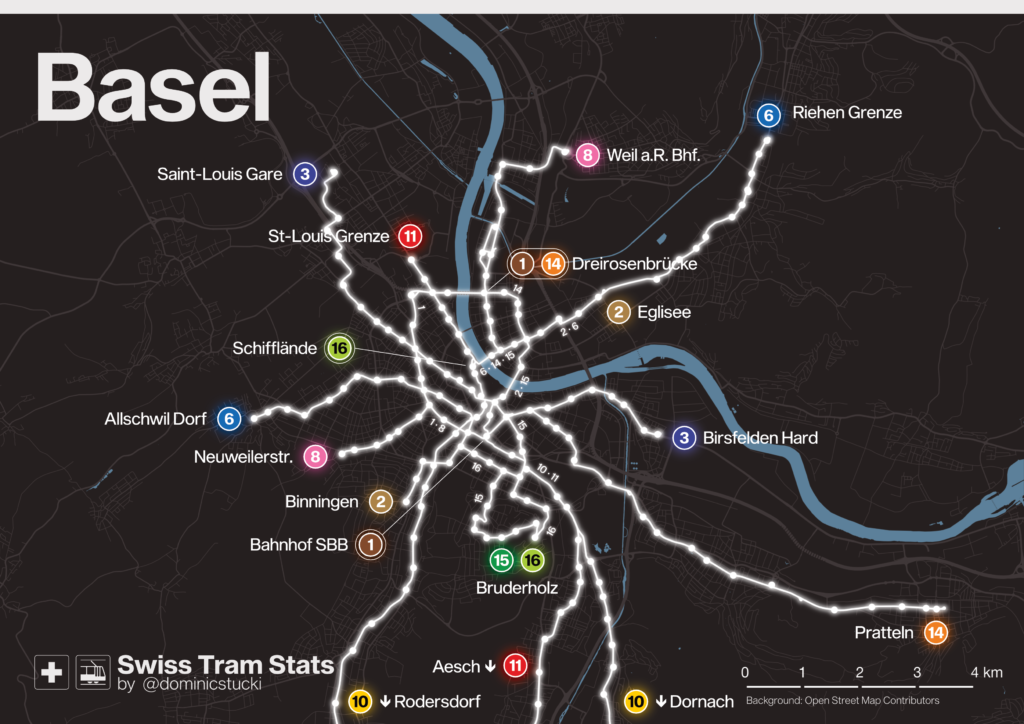
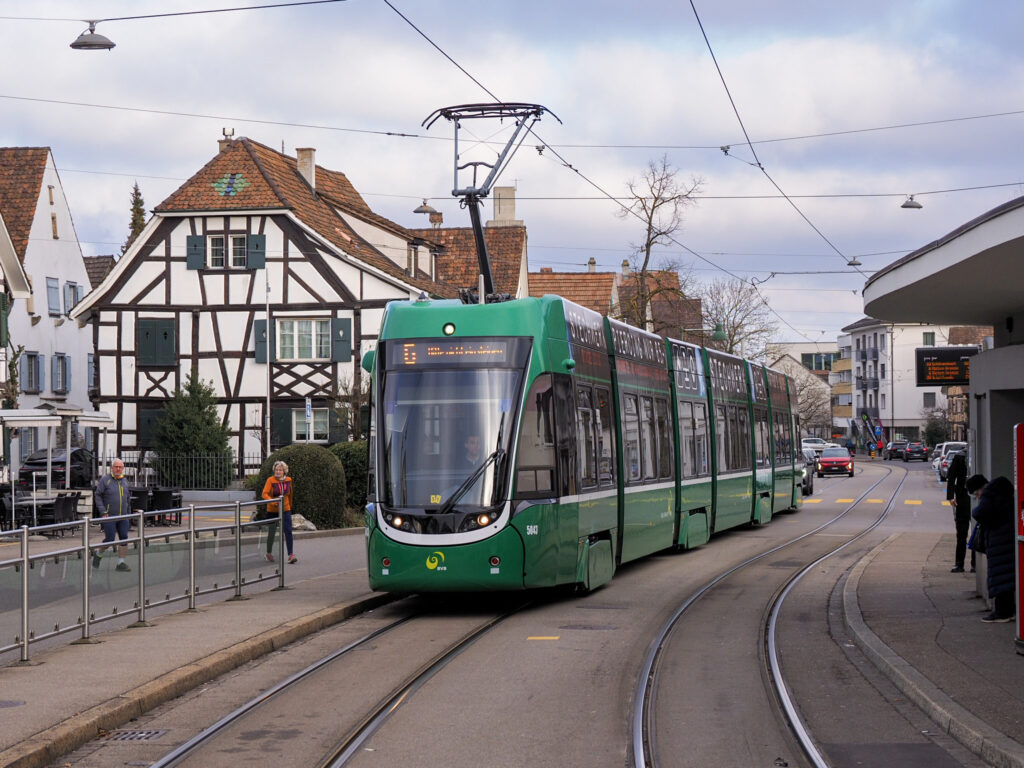
🟩 Basel (since 1892)
_01.2
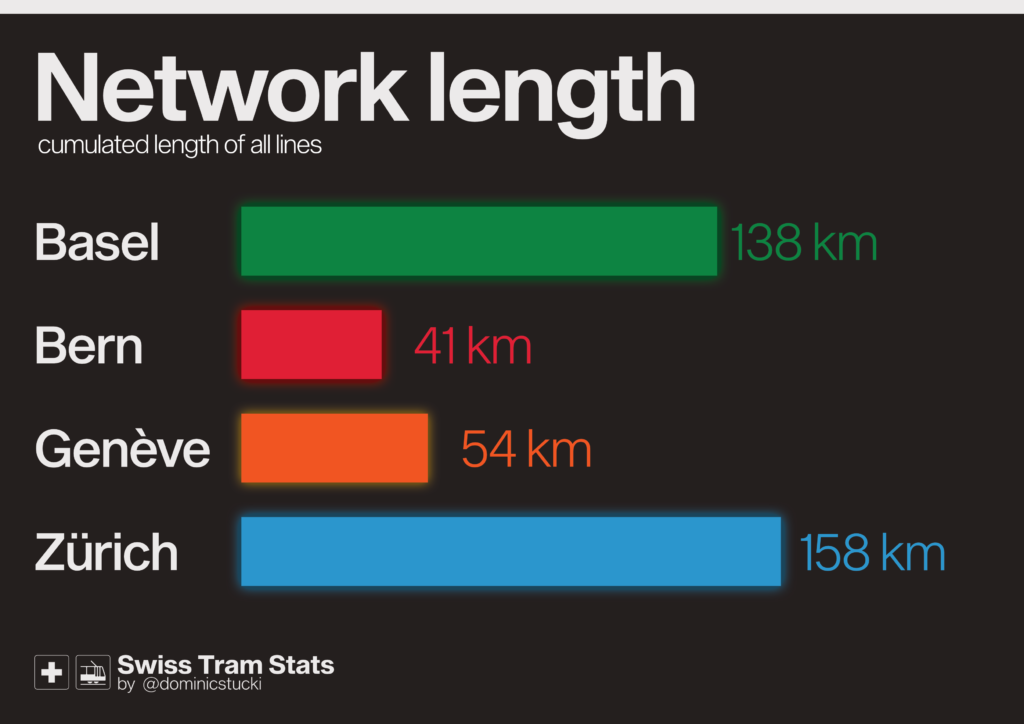
Network length
Zürich and Basel are by far the largest two networks with lines reaching way beyond the city limits.
_01.3
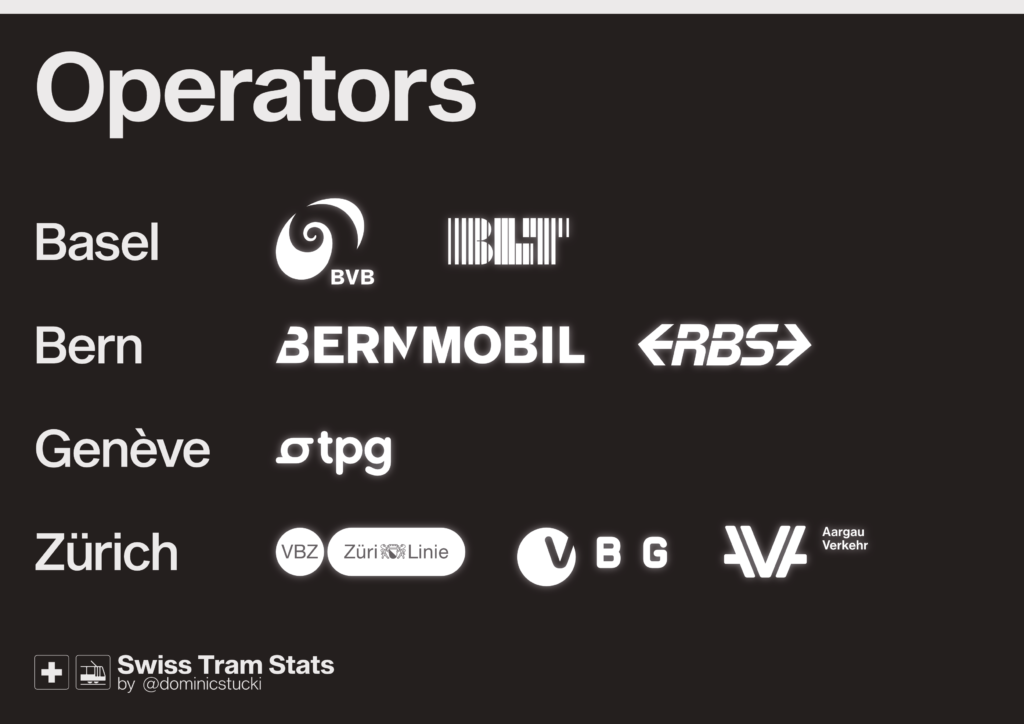
Network operators
A specialty of Switzerland’s tram networks is, that most of them are run by more than one operator or infrastructure owner. In fact, in all cities except Genève, there is more than one company running trams.
_01.4
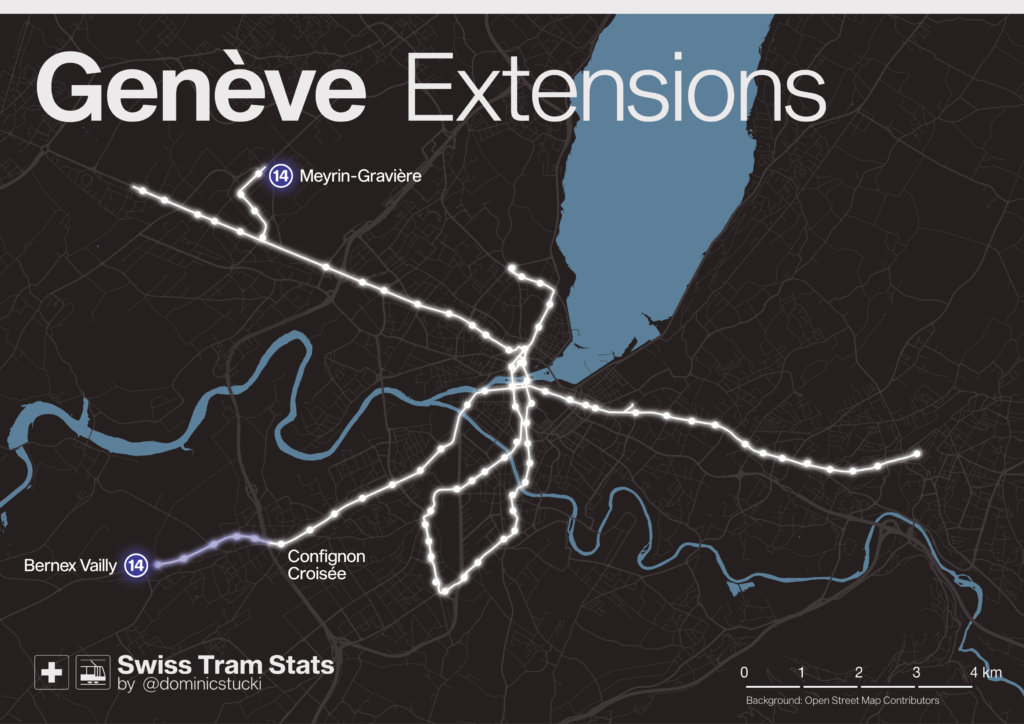
Network extensions
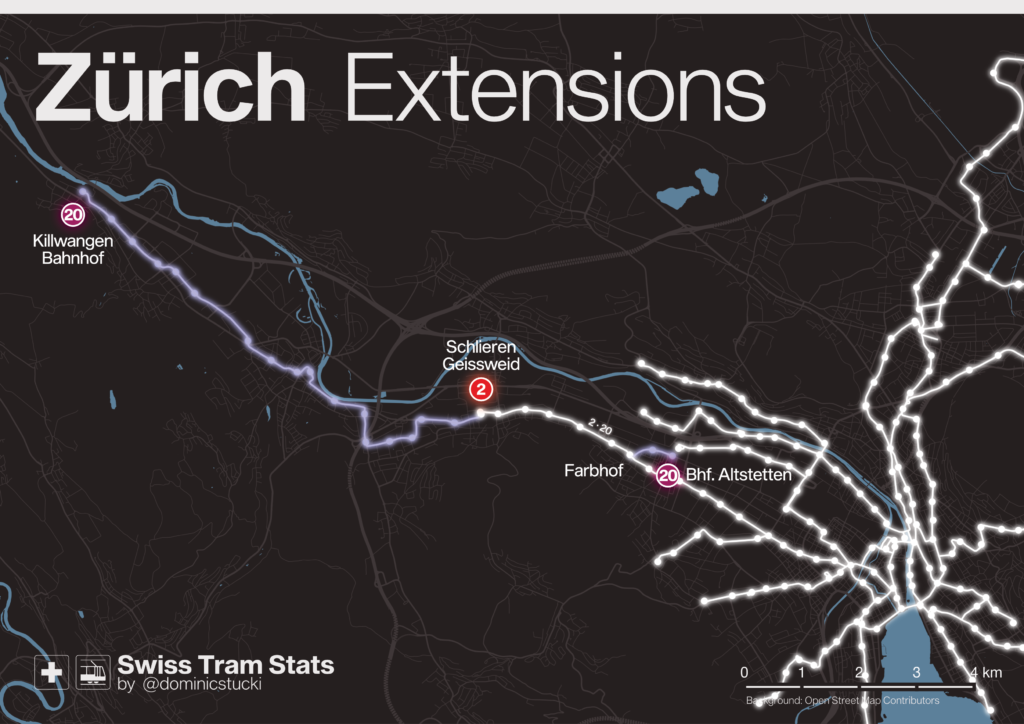
Within the two years since the last update, two new routes have been opened. The line 14 extension to Bernex near Genève and the second phase of the 13.1 km long «Limmattalbahn» LRT line in the Zürich network.
_01.5
Network growth
Thanks to the Limmattalbahn, Zürich overtook Genève in the network growth ranking. But considering that Genève only had one old, run-down 8km tram line left in the late Eighties, the numbers are impressive nevertheless.

_01.6
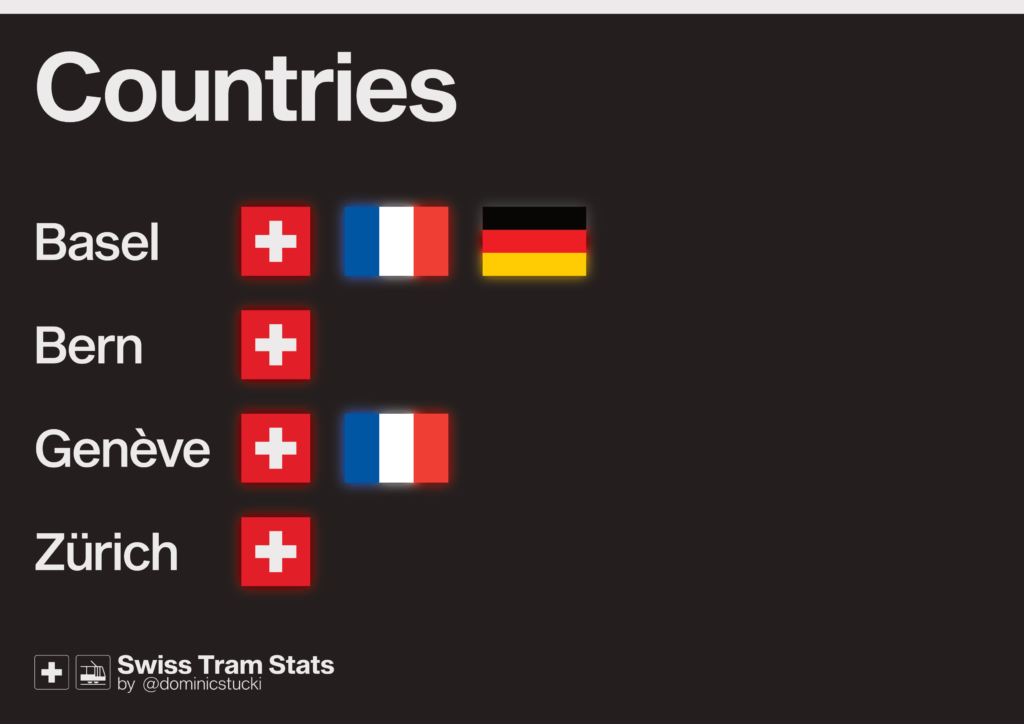
Countries
Two of the only three (?) international tram networks are in Switzerland: Genève and Basel. The Basel network connects three countries and three Swiss cantons!
_01.7
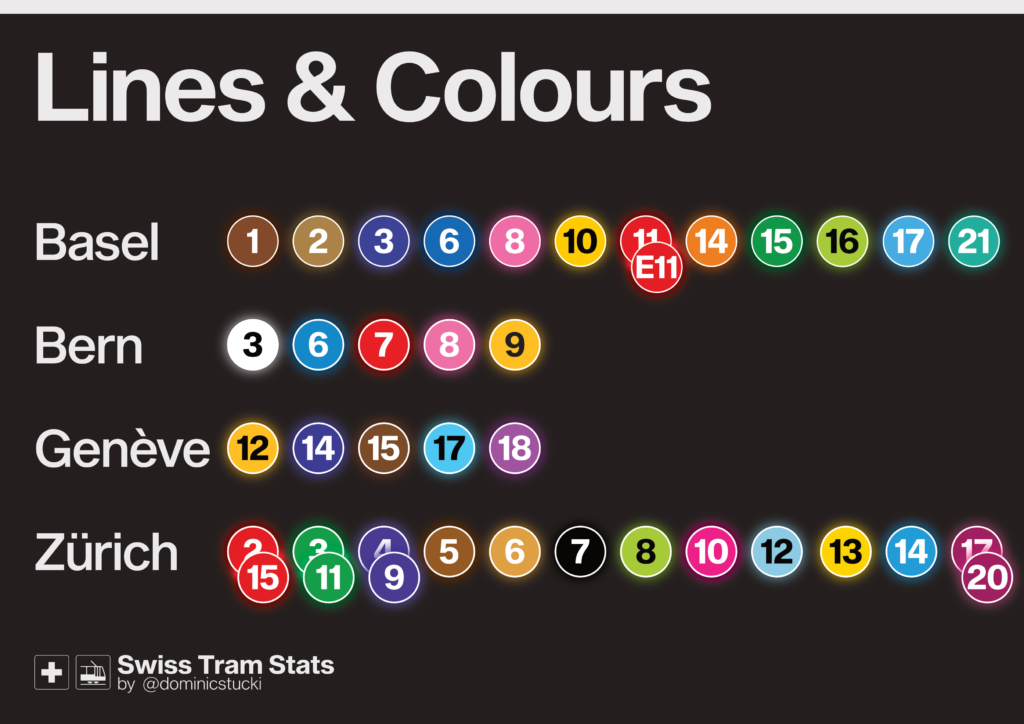
Lines & colours
For the fans of colours and numbers, here’s an overview of all lines and numbers. All four cities use a colour code, but only Zürich and Genève are consistently using the colours on vehicles and all media. 1 is the lowest, 21 the highest route number.
_02
Line Details
Having covered the overall statistics, we can now look at individual lines. How frequent do they run? How long are they? How many stops there are? These are not just numbers but also elements which can determine wether a tram network fits the needs of its users or not.
_02.1
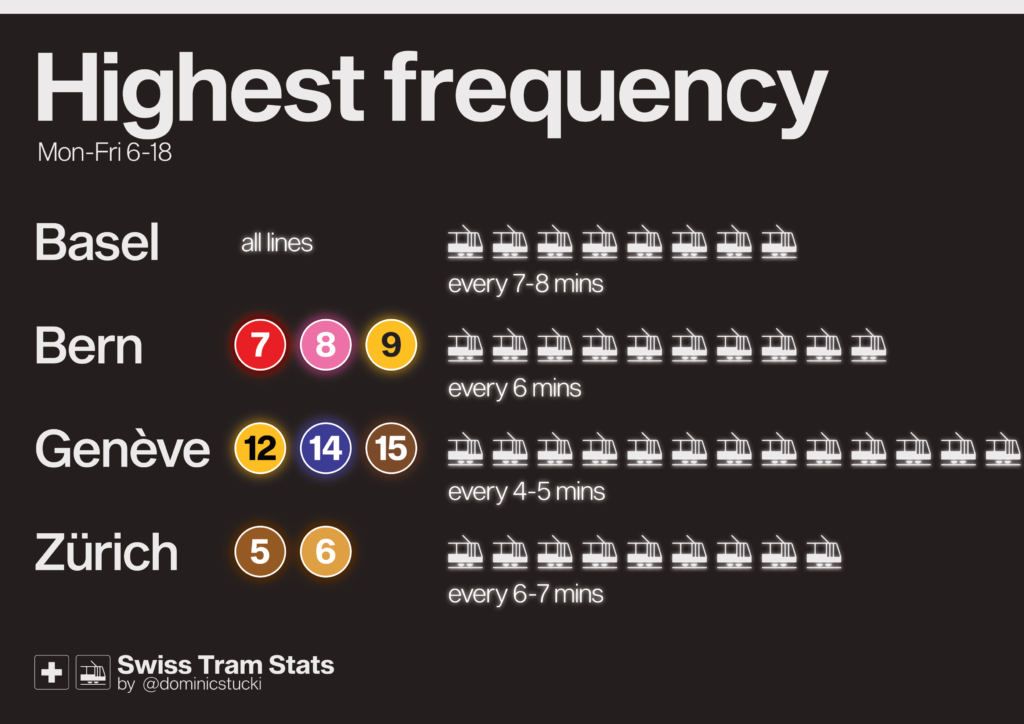
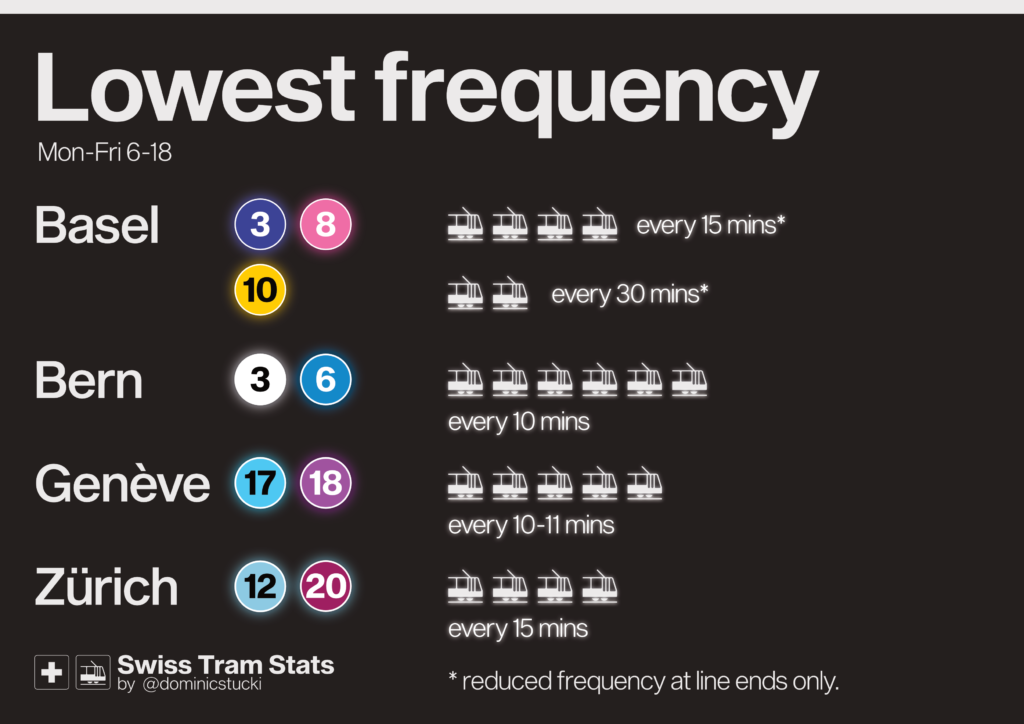
Frequency
Most lines run every 7-8 minutes during the day, but there are variances. Bern and Genève run some lines more frequently, in Zurich we see more departures on the lines 5 and 6 towards the Universities at peak hours.
On the other hand, Bern and Genève operate tram lines in the city centre with less than 8tph. These complement more frequent lines (Genève) or serve short routes (Bern). In Basel + Zurich, only routes outside the city in less populated areas have less than 8tph.
_02.2
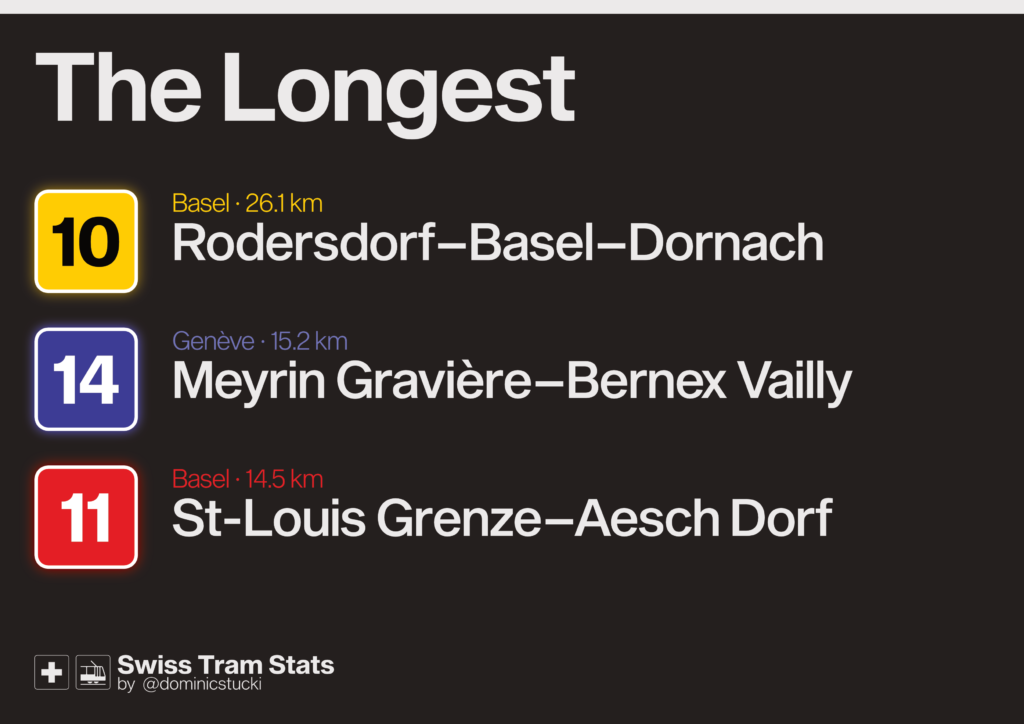
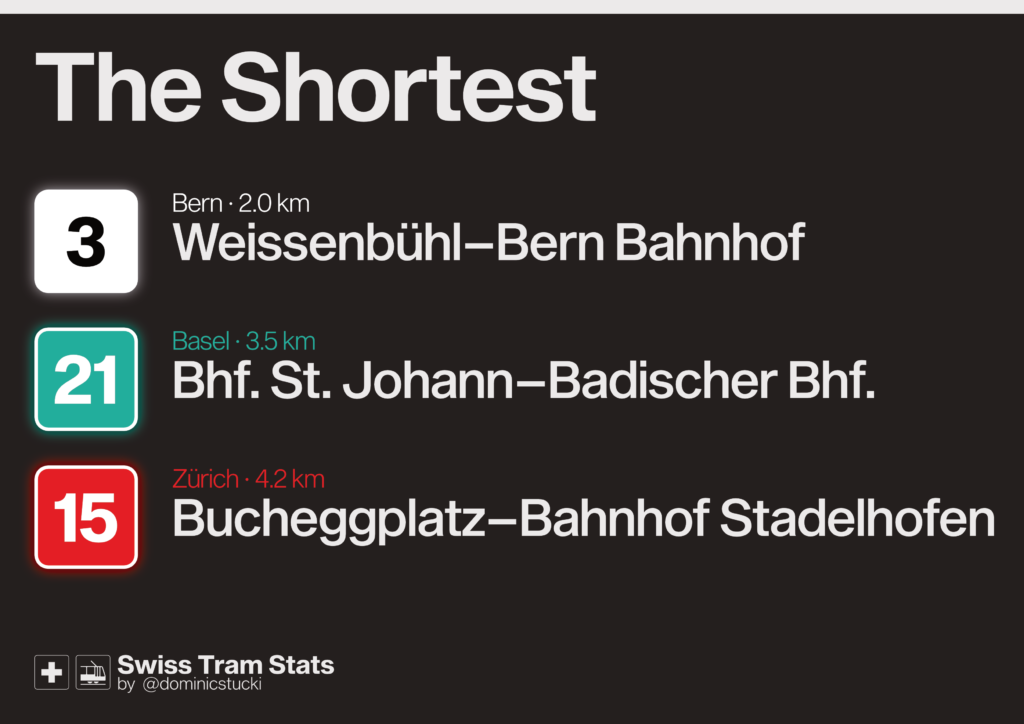
Line length
The longest line with an impressive 26km is Basel’s 10, a cross-city route which extends far out to the countryside. The shortest line is 3 in Bern, a radial route which ends at the main station.
_02.3
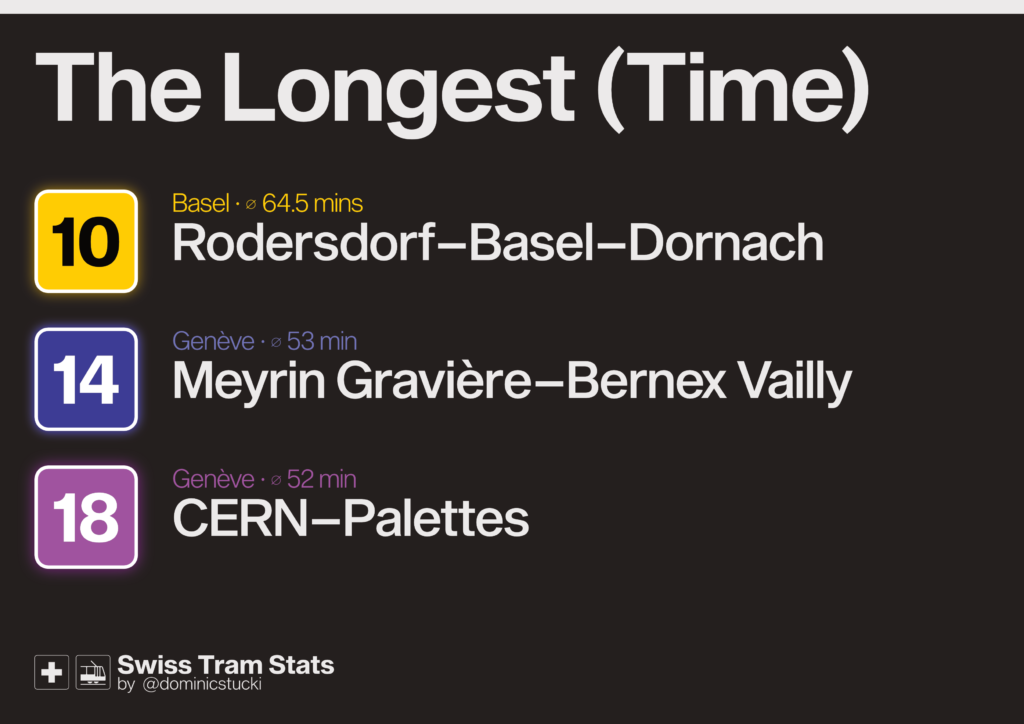
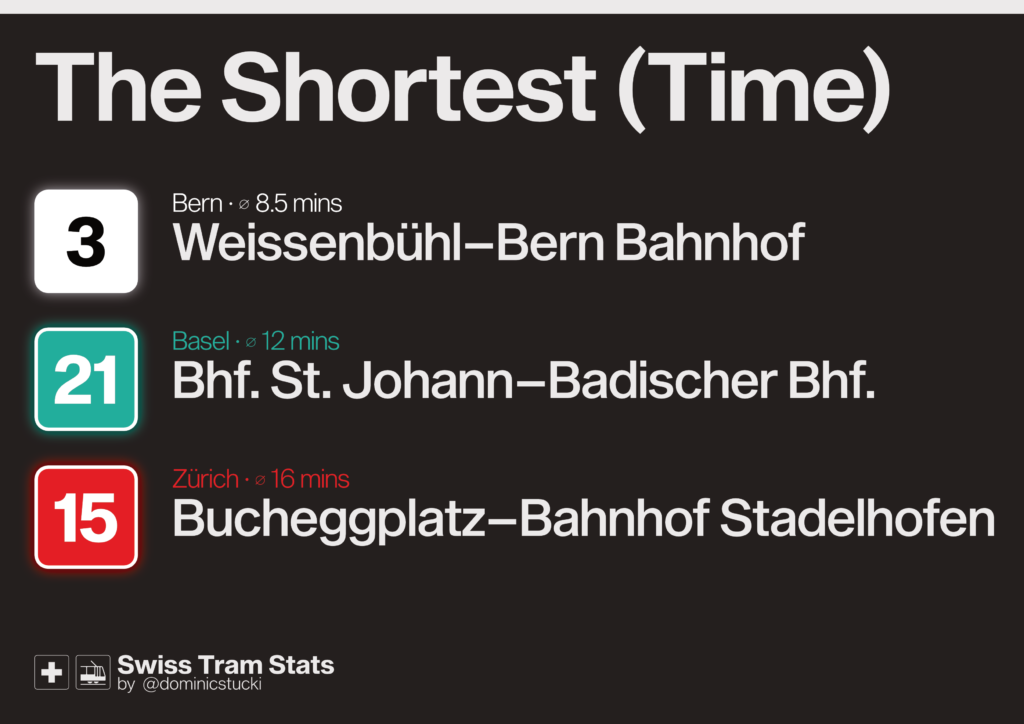
Travel times
Does the shortest line also have the shortest journey time? Yes, at least for the shortest three and the longest two on the list. Genève’s line 18 needs 52 minutes for 13km „only“.
_02.4
Number of stops
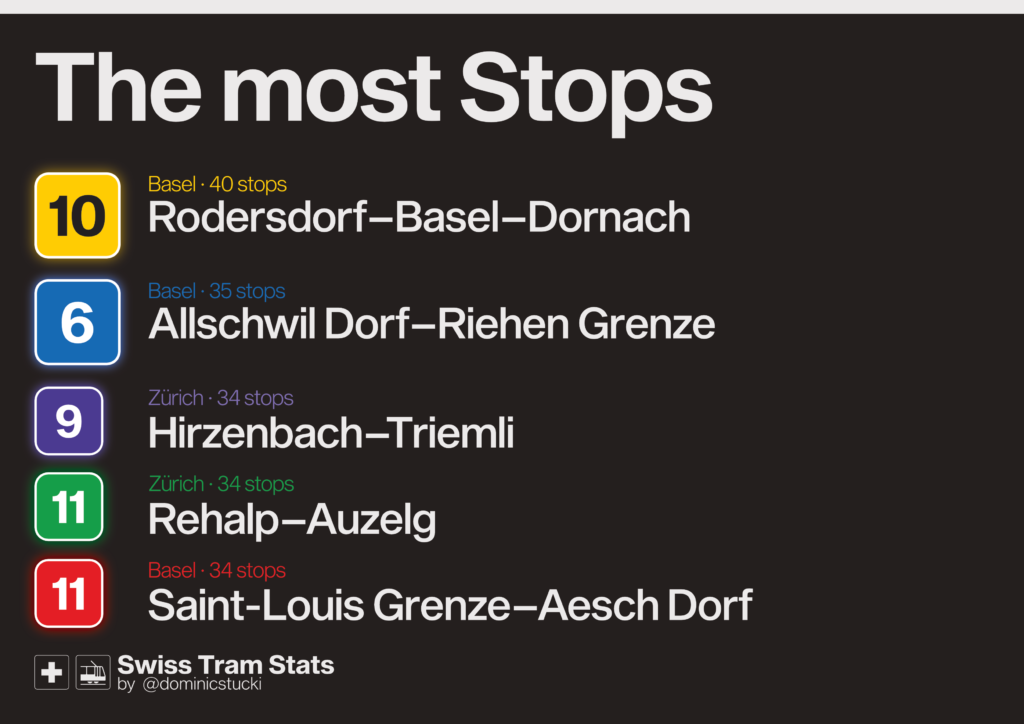
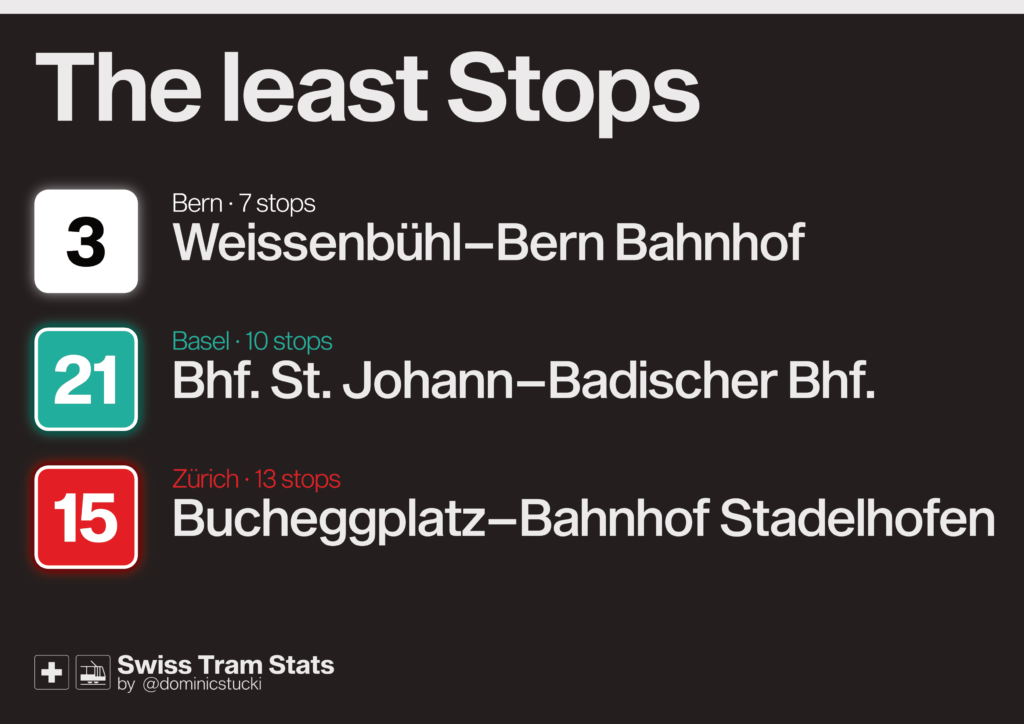
The number of stops correlates of course with line length, but that the top of the ranking for the shortest lines and for the least stops looks exactly the same still surprises me.
At the other end of the list, things look a bit more interesting, as new lines pop up. If you love the sound of a tram accelerating or opening tram doors, Basel’s line 10 is the place for you to go.
_03
Speed
This brings us to the more interesting part. Designing a good tram system is always a trade-off between high commercial speeds and good accessibility (high number of stops). So let’s see how Switzerland’s tram networks do.
_03.1
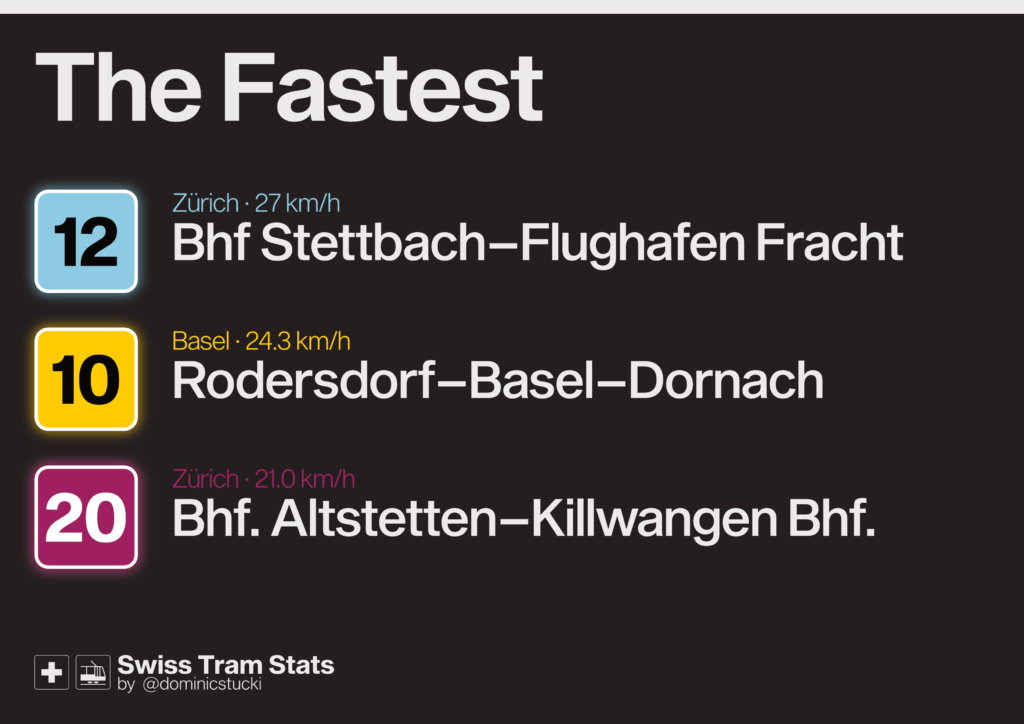
Fastest lines
First, a look at the extremes: The fastest tram lines are either modern LRT systems (Zürich’s line 12 and 20) or older conversions, where a regional railway was integrated into a tram network (Basel’s 10).
If you want to look at classic tram lines only, it looks like this: 7 (ZH) and 2 (BS) have some separated „high speed“ sections and a rather direct route through the city centres, but Bern’s 8 is a surprise to me.
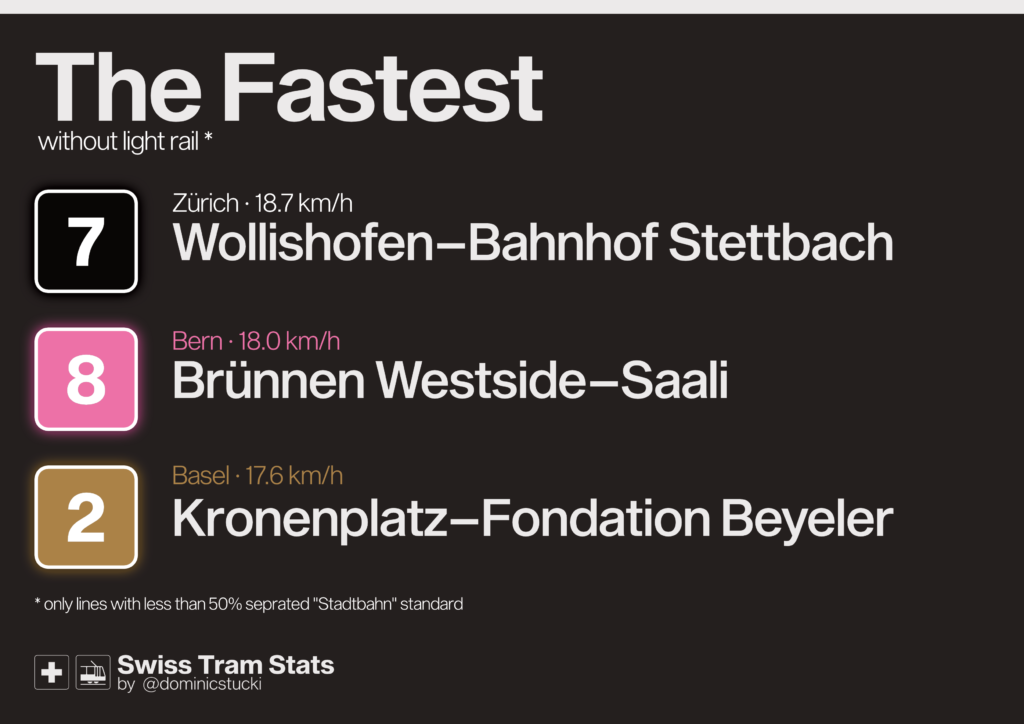
To achieve such speeds despite medium stop density and long street running sections, you typically need good tram priority at intersections and a clever tram-first street design, as for example on the relatively new parts of the route towards Brünnen Westside.
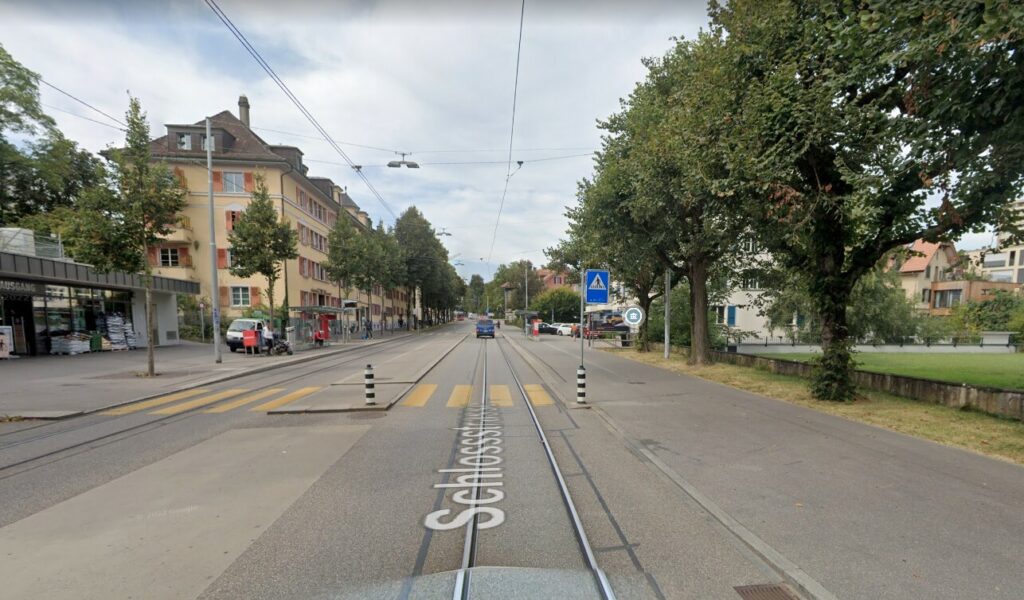
Bild: Google Street View
_03.2
Slowest lines
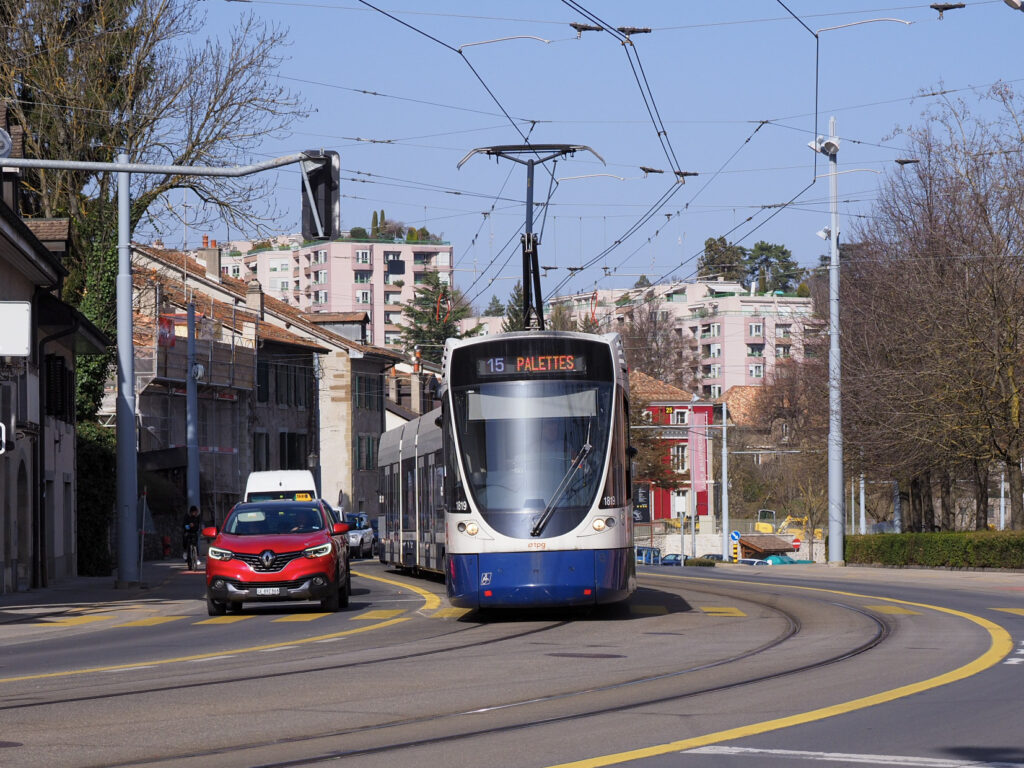
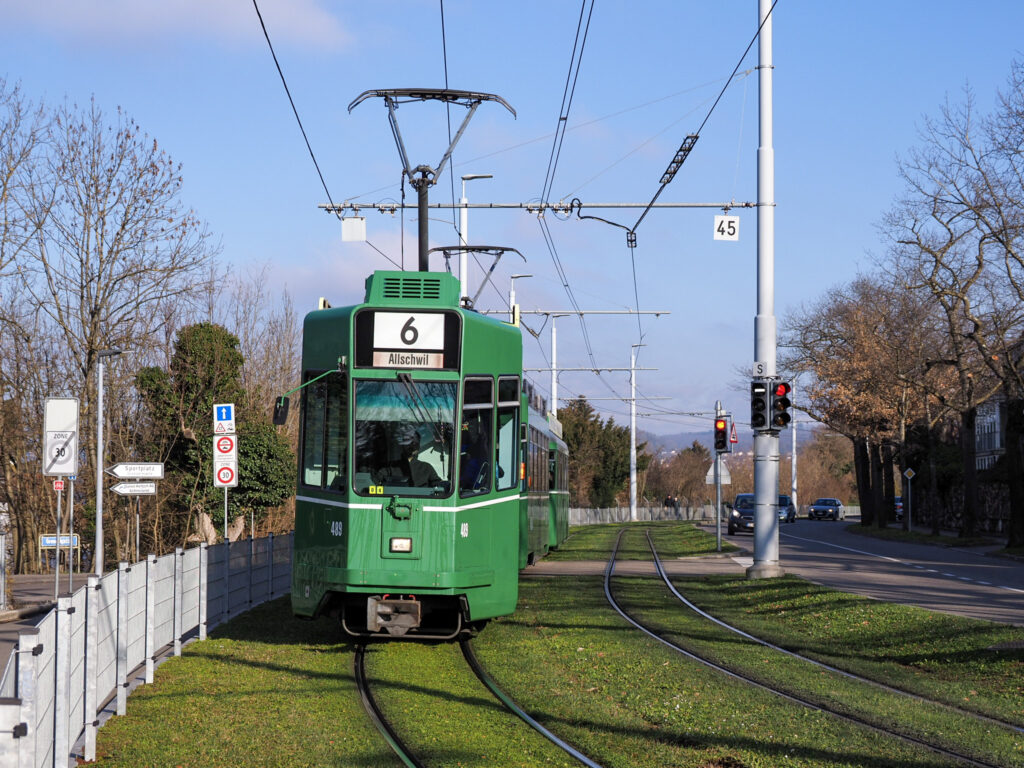
On the other end, we find our old friend No. 3 in Bern, and two other relatively short lines: Zürich’s mountainous and winding line 6 and the 15 in Genève. The latter is interesting: Despite a stop density of 0.37km, it’s very slow.
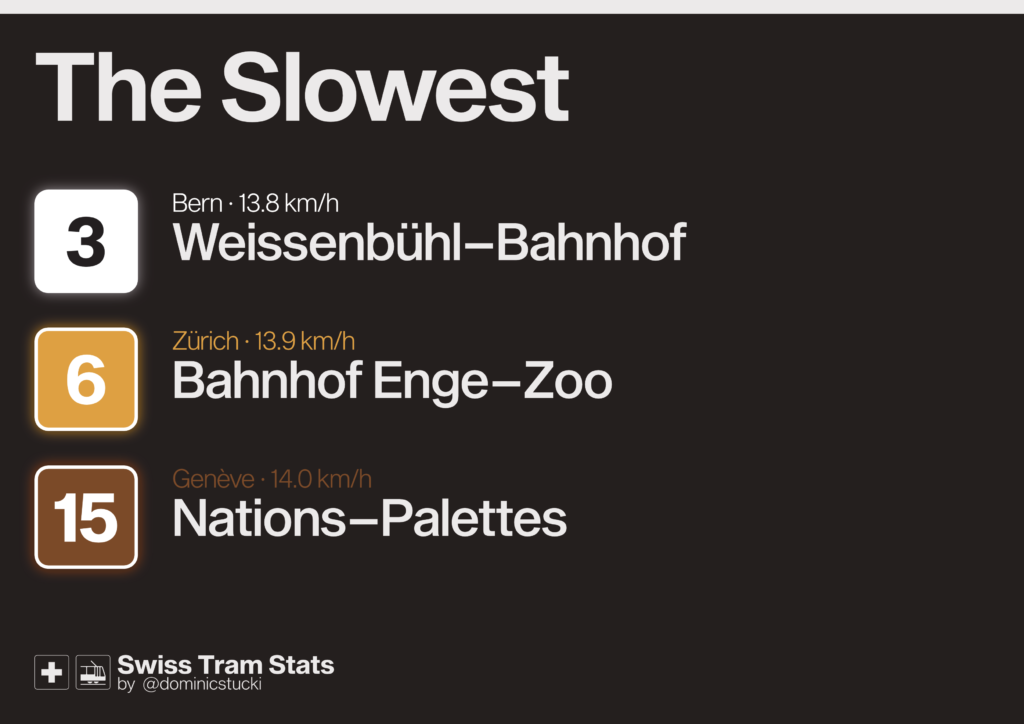
The 15 runs mostly in the city centre with a high amount of passengers, many intersections and thus a lot of conflicts with other traffic. I wonder how good tram priority is there…
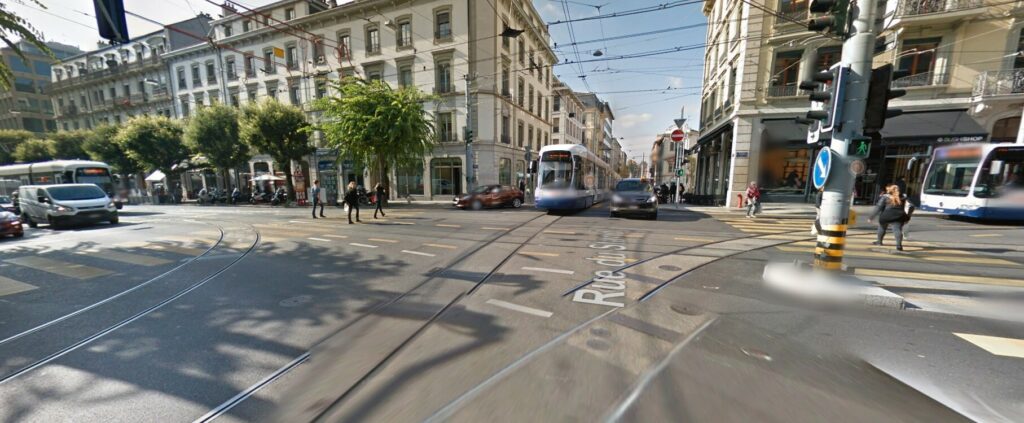
Bild: Google Street View
_04
Stop density
Apparently, dividing line length by travel time gives you a number, but iterpreting those can sometimes be hard. You can loose a lot of travel time on winding lines with slow maximum speeds or at intersections with bad or non-existent priority for trams. But there is an even more important factor: The number of stops. A stop on a tram line easily costs you 30-45 seconds. The number of stops is therfore not only important for the line’s catchment area but also for its commercial speed. Let’s have a closer look.
_04.1
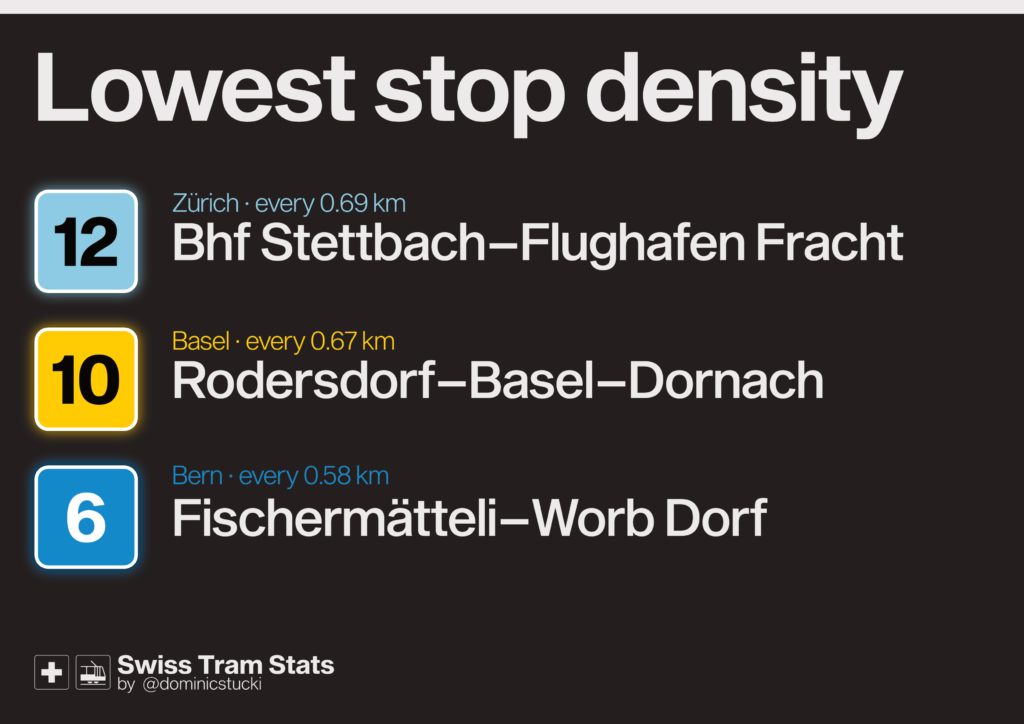
Lowest stop density
Too many stops make trams painfully slow. No problem at all with this on the lines shown here. Again we see Zürich’s modern Glattalbahn LRT and two former regional railway lines converted to trams (10 in Basel and 6 in Bern) with >50% of the route on the former railway alignment.
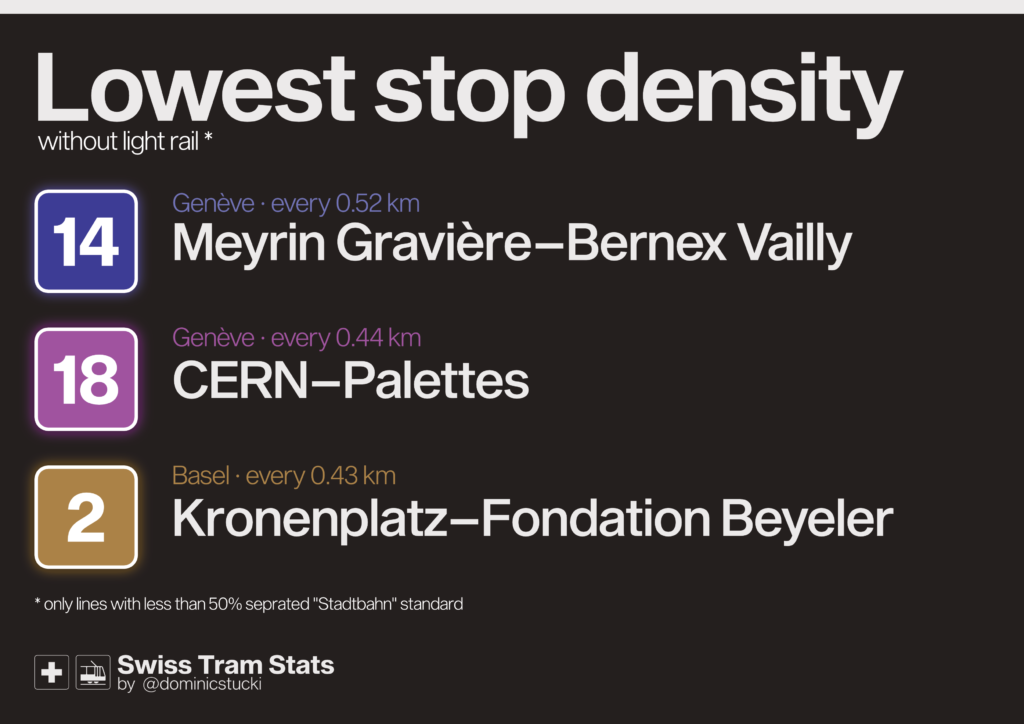
But: How about „classic“ street running tram lines? Well, if you want to know how to build new tram lines, go have a look at Genève! The completely new line 14 and the half-new 18 both don’t bother with stopping to much. Basel’s line 2 owes its high commercial speed to the low stop density (see 3.1). It’s noteworthy that despite their low stop density neither Genève’s 14 nor 18 appears in the top three fastest tram lines in chapter 3.1. We might be up to something here…
_04.2
Highest stop density
You don’t have to walk far to the next stop if you follow Basel’s 16, the already familiar mini-line 3 in Bern and – interestingly – Zürich’s line 4, despite its rather new LRT-ish part between Escher-Wyss-Platz and Bahnhof Altstetten.
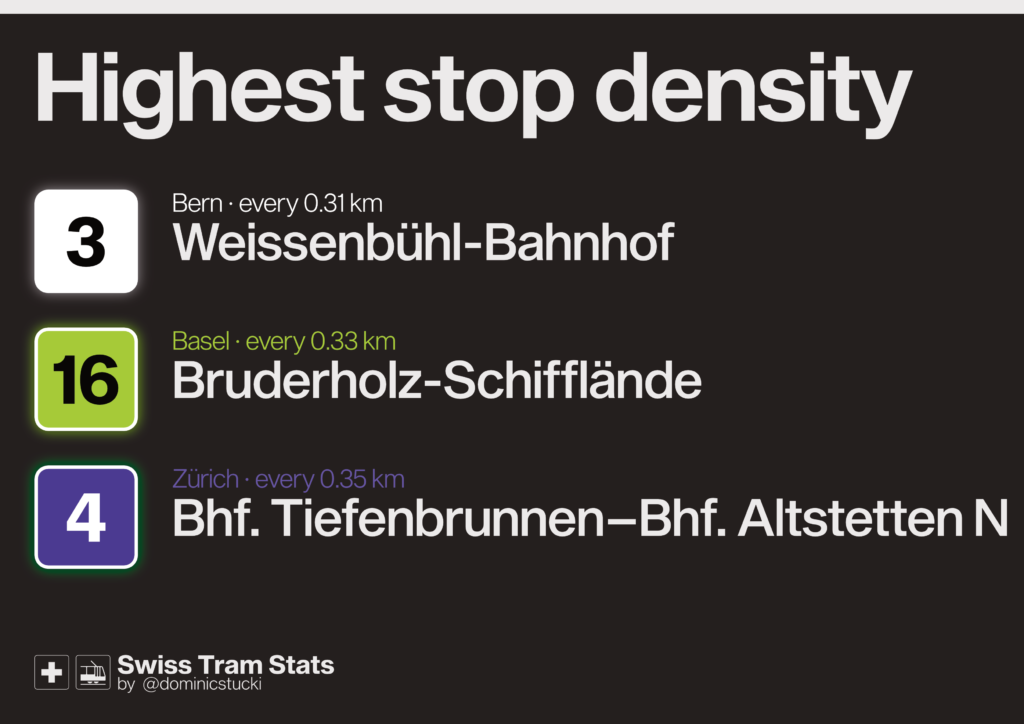
But again: Neither Basel’s 16 nor Zürich’s 4 appear in the top 3 of the slowest line, despite having a really high stop density.
_05
Speed & stops
Now we have all we need to plot the main graph. We can finally put the commercial speed of a line into relation with its stop density and compare it with other lines in the same network and in Switzerland overall.
_05.1
Overview
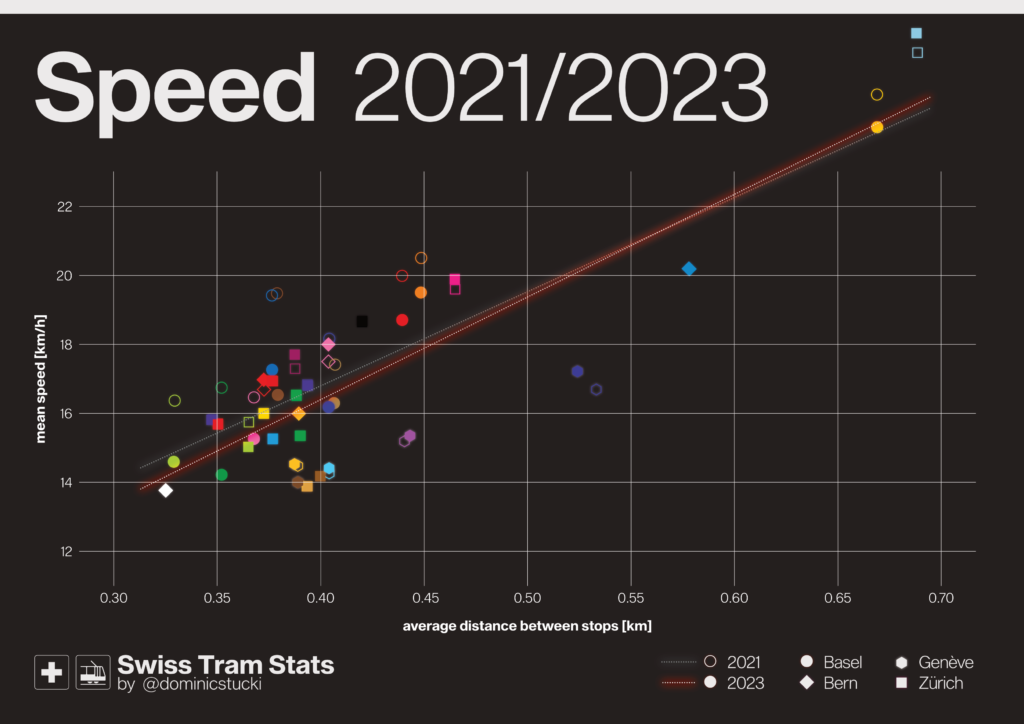
This plot shows the commercial speed and mean stop density of all tram lines in Switzerland. Tram lines above the regression line have speeds above average in relation to their stop density.
Note the two outliers in the top right corner: Basel’s line 10 and Zürich’s 12 which we know already from the mean speed and stop density high scores.
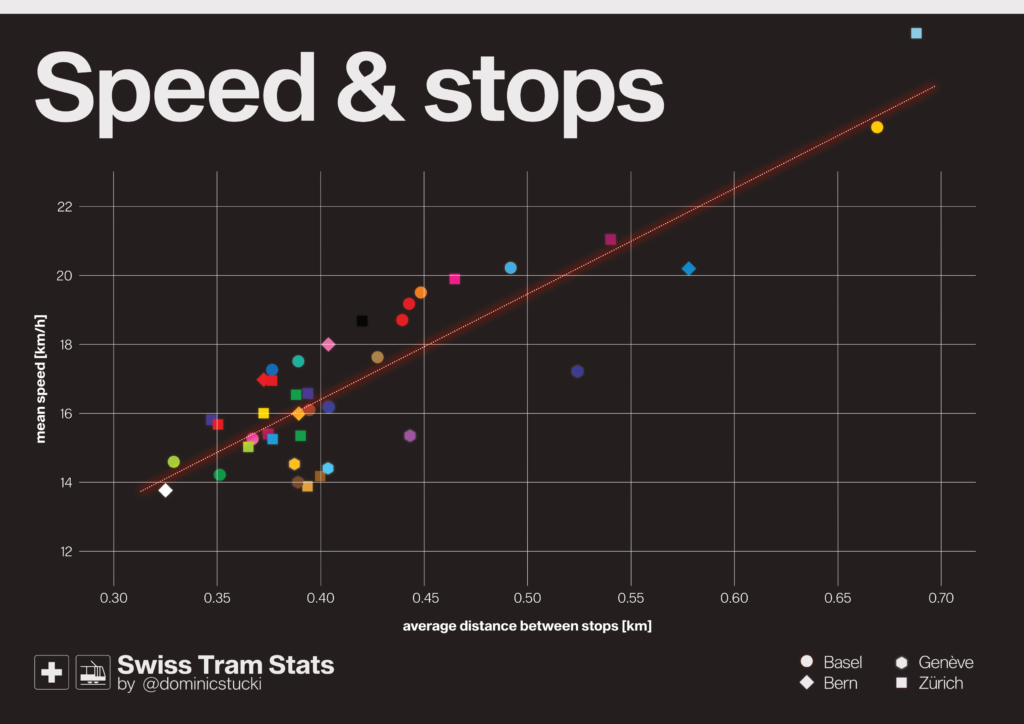
Let’s break it down per network:
_05.2
Zürich
🟦 Zürich in general has a pretty high stop density. Most lines are between 15 and 17 km/h and one stop every 0.35-0.40km. 10, 12 and 20 run on separated LRT infrastructure for parts or even all the line.

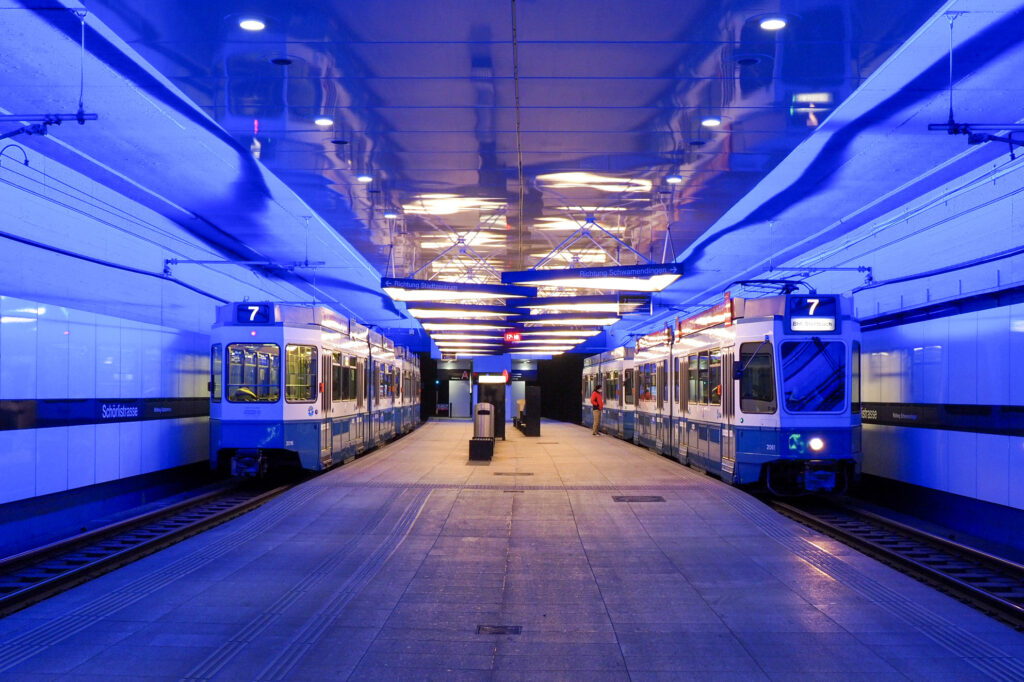
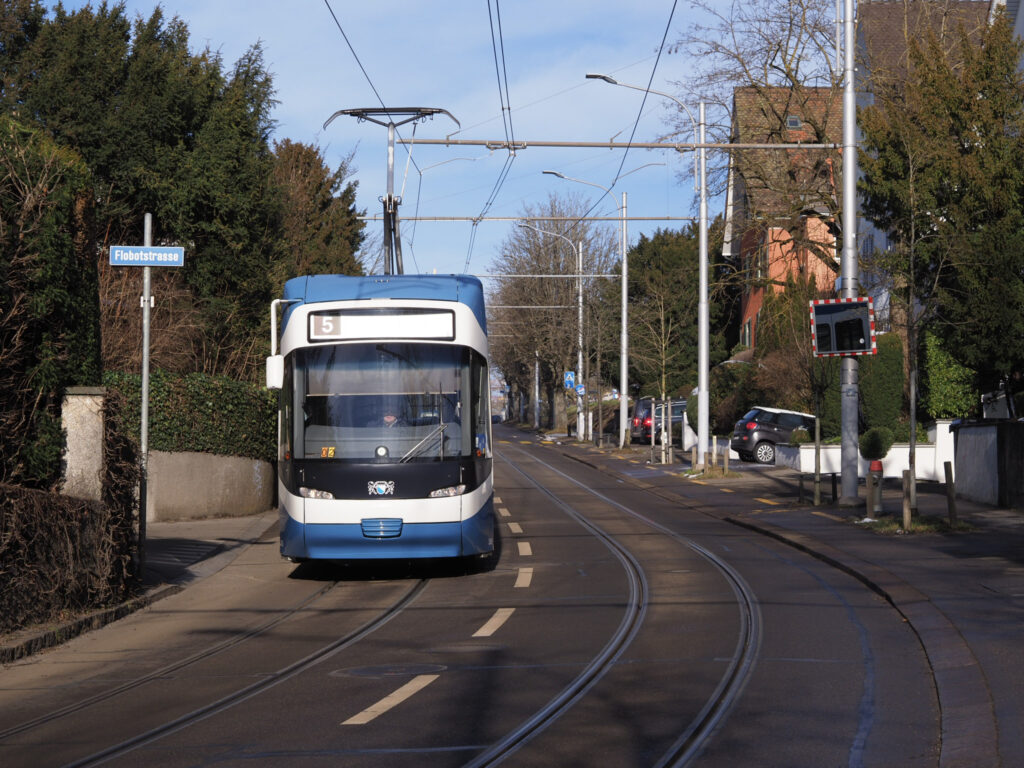
The 7 shows an exceptionally low stop density and benefits from the 2.5 km Schwamendingen tram tunnel (📷1) with only three stops and a maximum speed of 60 km/h. Line 5 and 6 are the steep, winding mountain lines (📷2), have a large portion of the line in the centre and cross several important intersection, which all makes them slow.
Some people over on twitter missed the Forchbahn regional railway, which uses part of the Zürich tram network to get out of the city. I excluded it on purpose (again: most part of the line, it’s a standard narrow gauge railway) but just in case, here’s the Zürich chart with the Forchbahn (S18).

_05.3
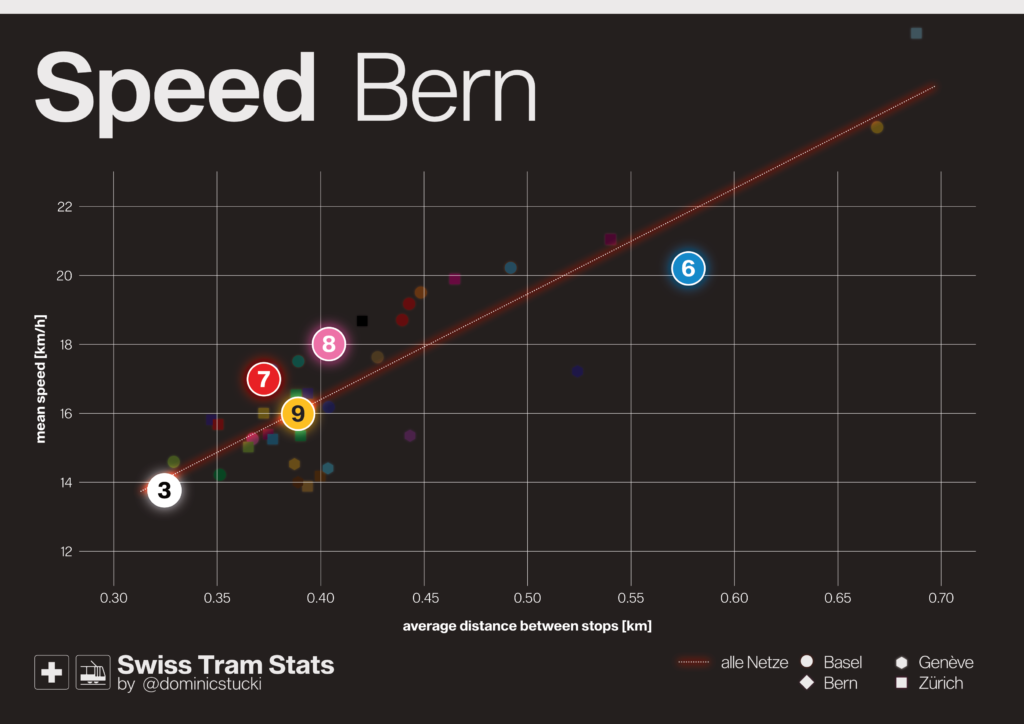
Bern
🟥 Bern’s trams are – astonishingly, as Bern is considered to be a „slow“ city – relatively fast. Except for the short line 3, slowest of all, and the 6 with moderate speeds for an integrated former railway (possibly due to single track and large city centre part).
_05.4
Basel
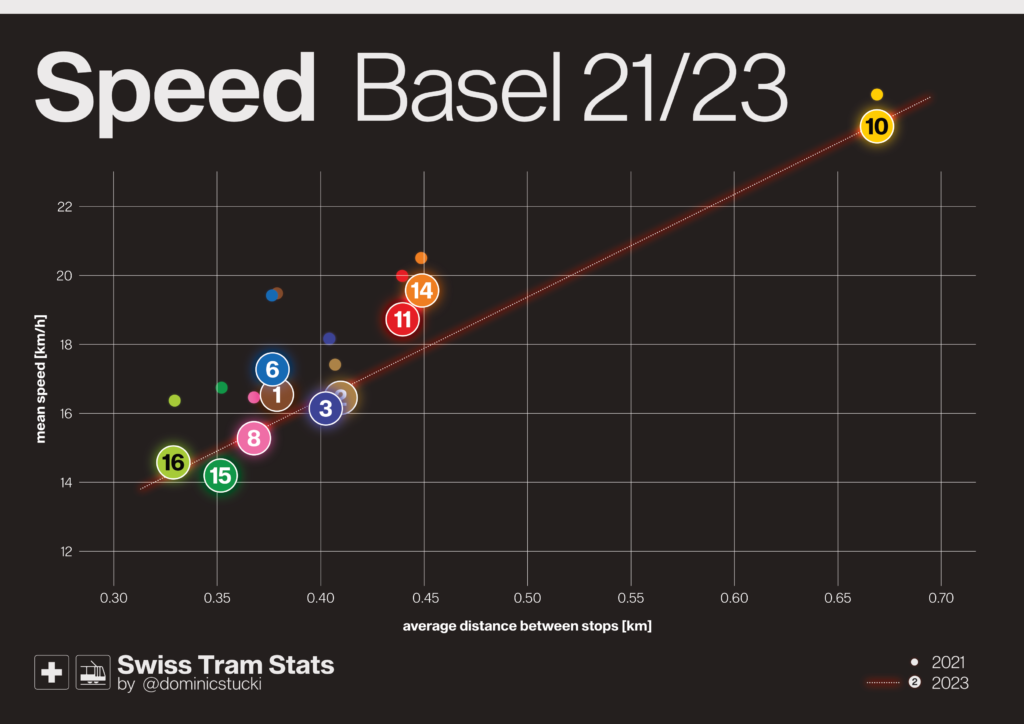
🟥 Basel has probably the fastest network with nearly all the lines above the regression curve. Stop density is comparably low. Many of Basel’s lines benefits from a light-rail-like infrastructure on the outer parts of the network, built in the early 1900s!
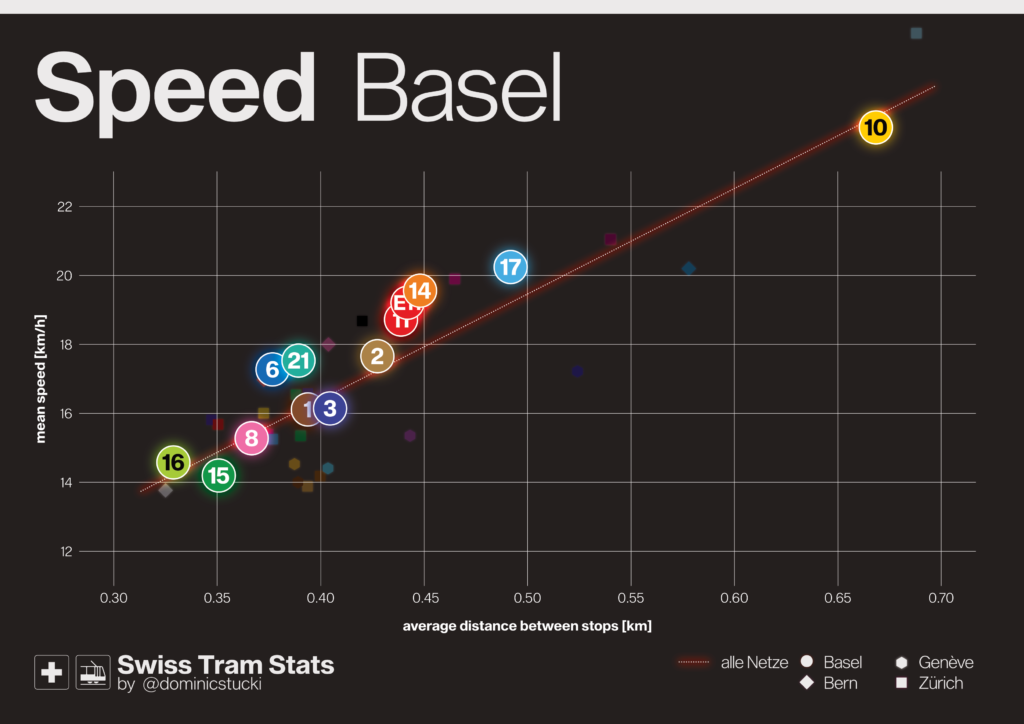
Examples are lines 2/6 to Riehen and 14 to Pratteln. The lines 10, 11 and 17 are former interurban trams or railways, integrated into the tram network in the 1980s, combined with double tracking all the lines.
_05.5
Genève
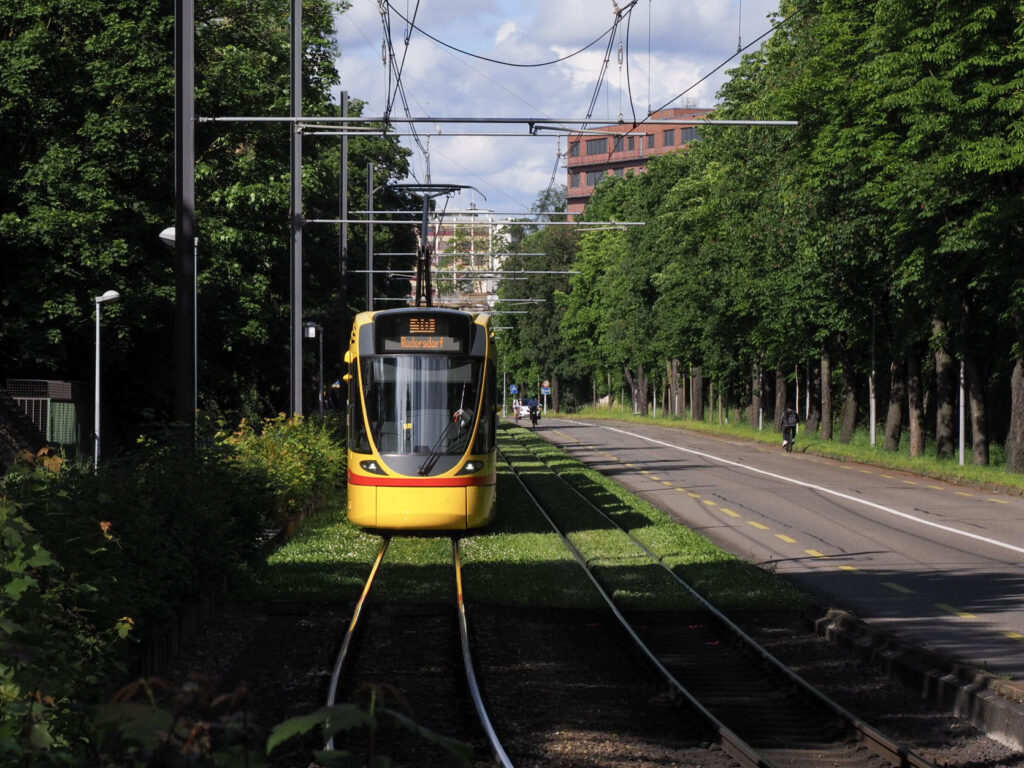
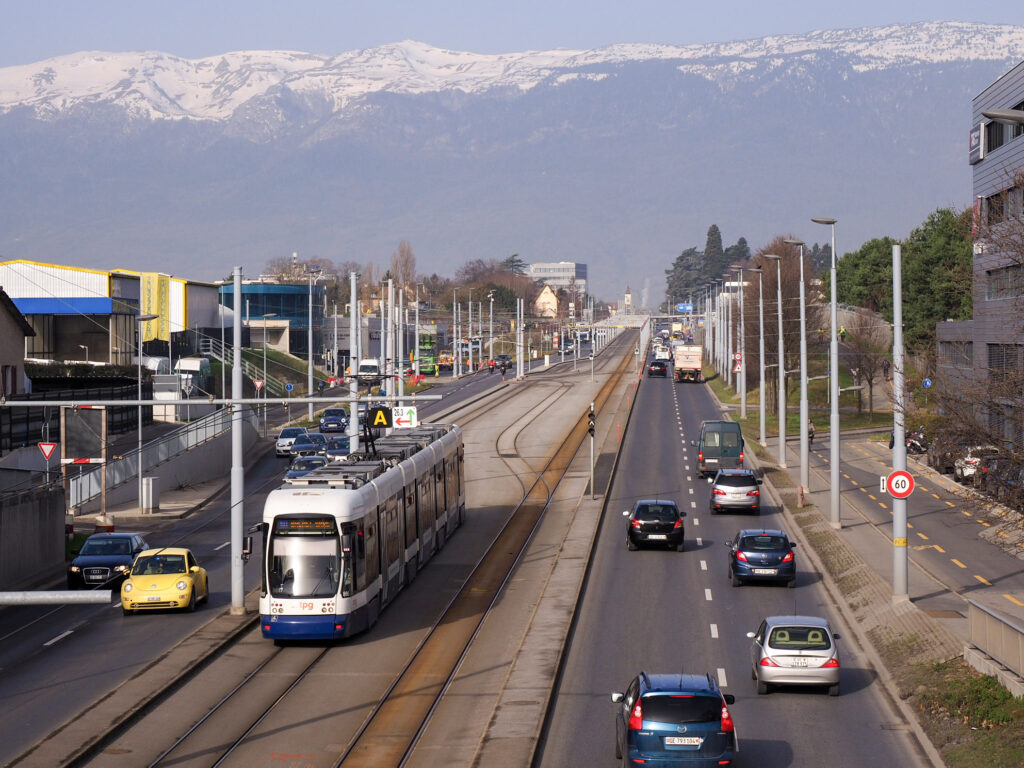
🟧 Genève… well, we have a little problem here, as you can see here. Even if a better part of the network was newly built within the last 30 years, the lines are painfully slow. And this despite the low stop density and some very good infrastructure.
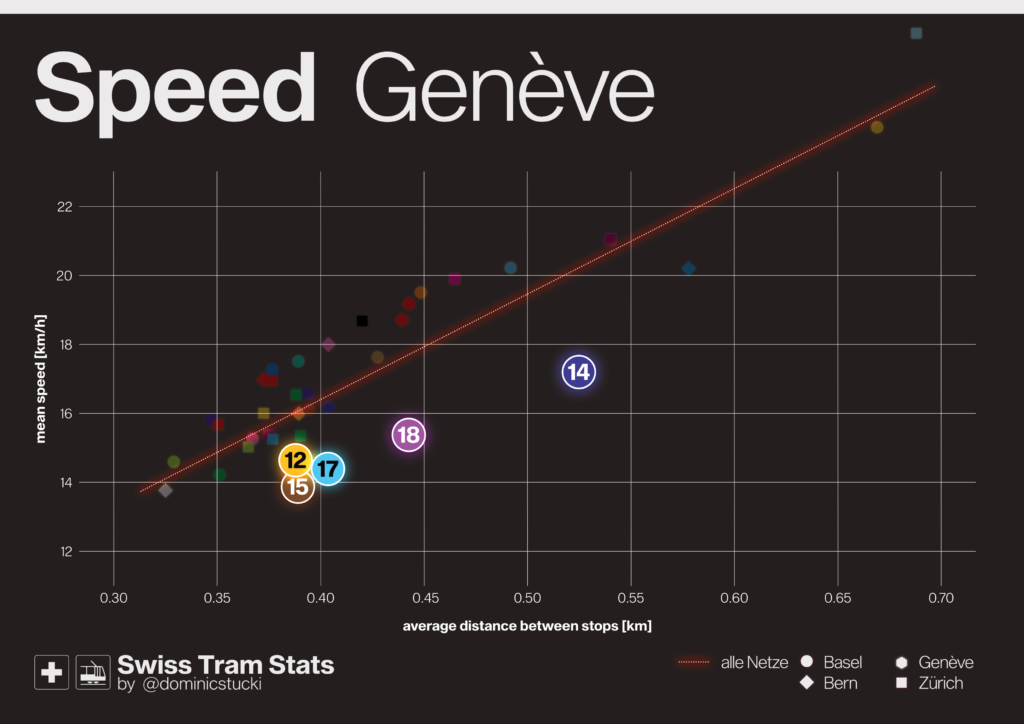
One problem is of course the notoriously congested city centre, but also mean speeds on the new sections are not very high. Look for example at the northern branch of lines 14 and 18 – perfect! What more do you want as infrastructure? But they’re still slow…
Without knowing the real causes, I suspect too much padding in the timetables and improvable priority at intersections. If you know the reason – please get in contact, I’d love to add it here.
_05.6
2023 vs 2021
Also interesting: Comparison between my lasts stats from 2021 and the 2023 timetable. As you can see from the regression curve, the LRT parts of the network became faster (mainly due to the new Limmattalbahn and a little timetable adjustment on the Glattalbahn), but the inner city sections apparently became slower!
Speeds seem to have decreased mainly in Basel, which becomes clear when we plot just the Basel lines from 2021 and 2023. It seems that they added 1 or 2 minutes of additional padding to every line!
A user over at twitter pointed out, that travel time through the central section increased by up to 50 seconds due to a new stop layout
_05.7
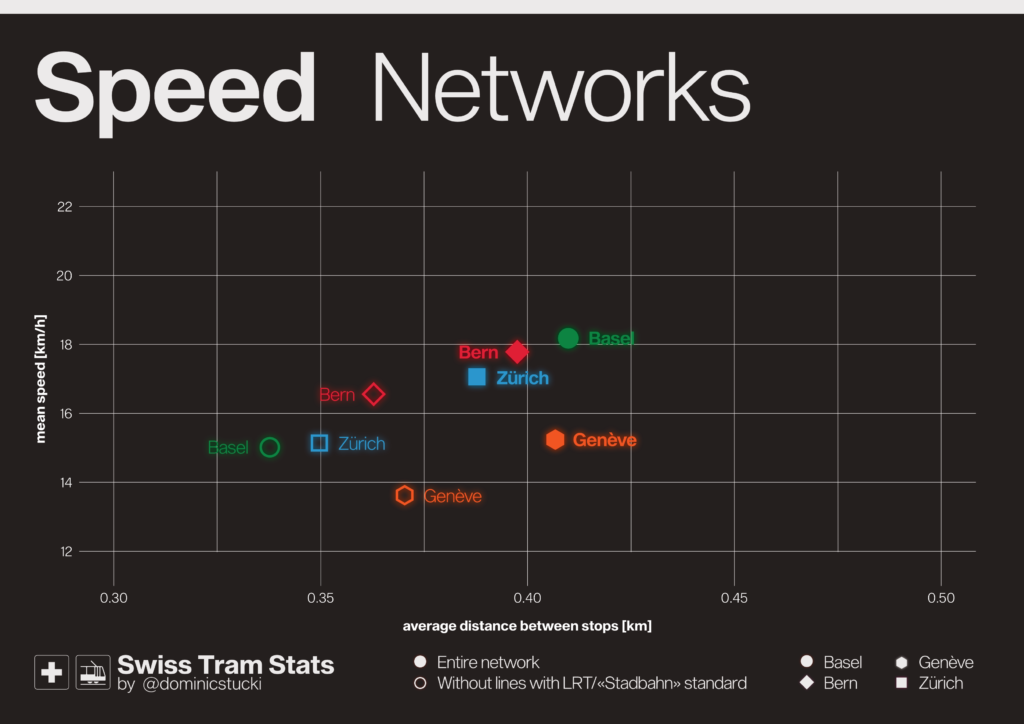
Summary
To round it all up, summary on network level. Basel is the fastest overall Network. If you look at classic trams only, Bern takes the crown. Genève is slowest – I hope that this will improve in the future, as the rest of their tram plans are really promising!
_Sources
- Travel time data is from the 2023 timetables, usually drived from the times indicated on the line strip maps provided by the operators.
- Line length is measured on Open Street Map data using the fantastic BRouter web tool.
- Data for the maps is provided by OpenStreetMap, courtesy to the OpenStreetMap contributors.
_Download
I provide all Swiss Tram Stats 2023 plots as *.png files for Download in a ZIP-folder below. Please note that I cannot guarantee the accuracy of the information provided.

The files are provided unter the CC BY-NC 4.0 licence.
I kindly ask you to respect the licences terms.
_Social Media
Swiss Tram Stats 2023 was first published on Mastodon. This web article is a slightly adapted version of the Mastodon thread.